Using Microsoft Power BI in Schools
These are some lessons learned and observations from the last 12 months of writing bespoke Power BI reports and delivering Power BI training to multi-academy trusts. They may help other schools and trusts that are about to start on a Power BI journey.
Most of the reports were bespoke reports that look at Key Stages 1 & 2 data - multi page reports that give the central team and staff with responsibility for school improvement a detailed overview of student performance across the trust.
Longley Park Sixth Form College in Sheffield was different. They ended up with a mix of training and report writing - a ‘summary markbook’ Power BI report that refreshes each month and shows a ‘red, amber, green’ summary of individual student performance across departments and courses.
Here are some thoughts and lessons learned:
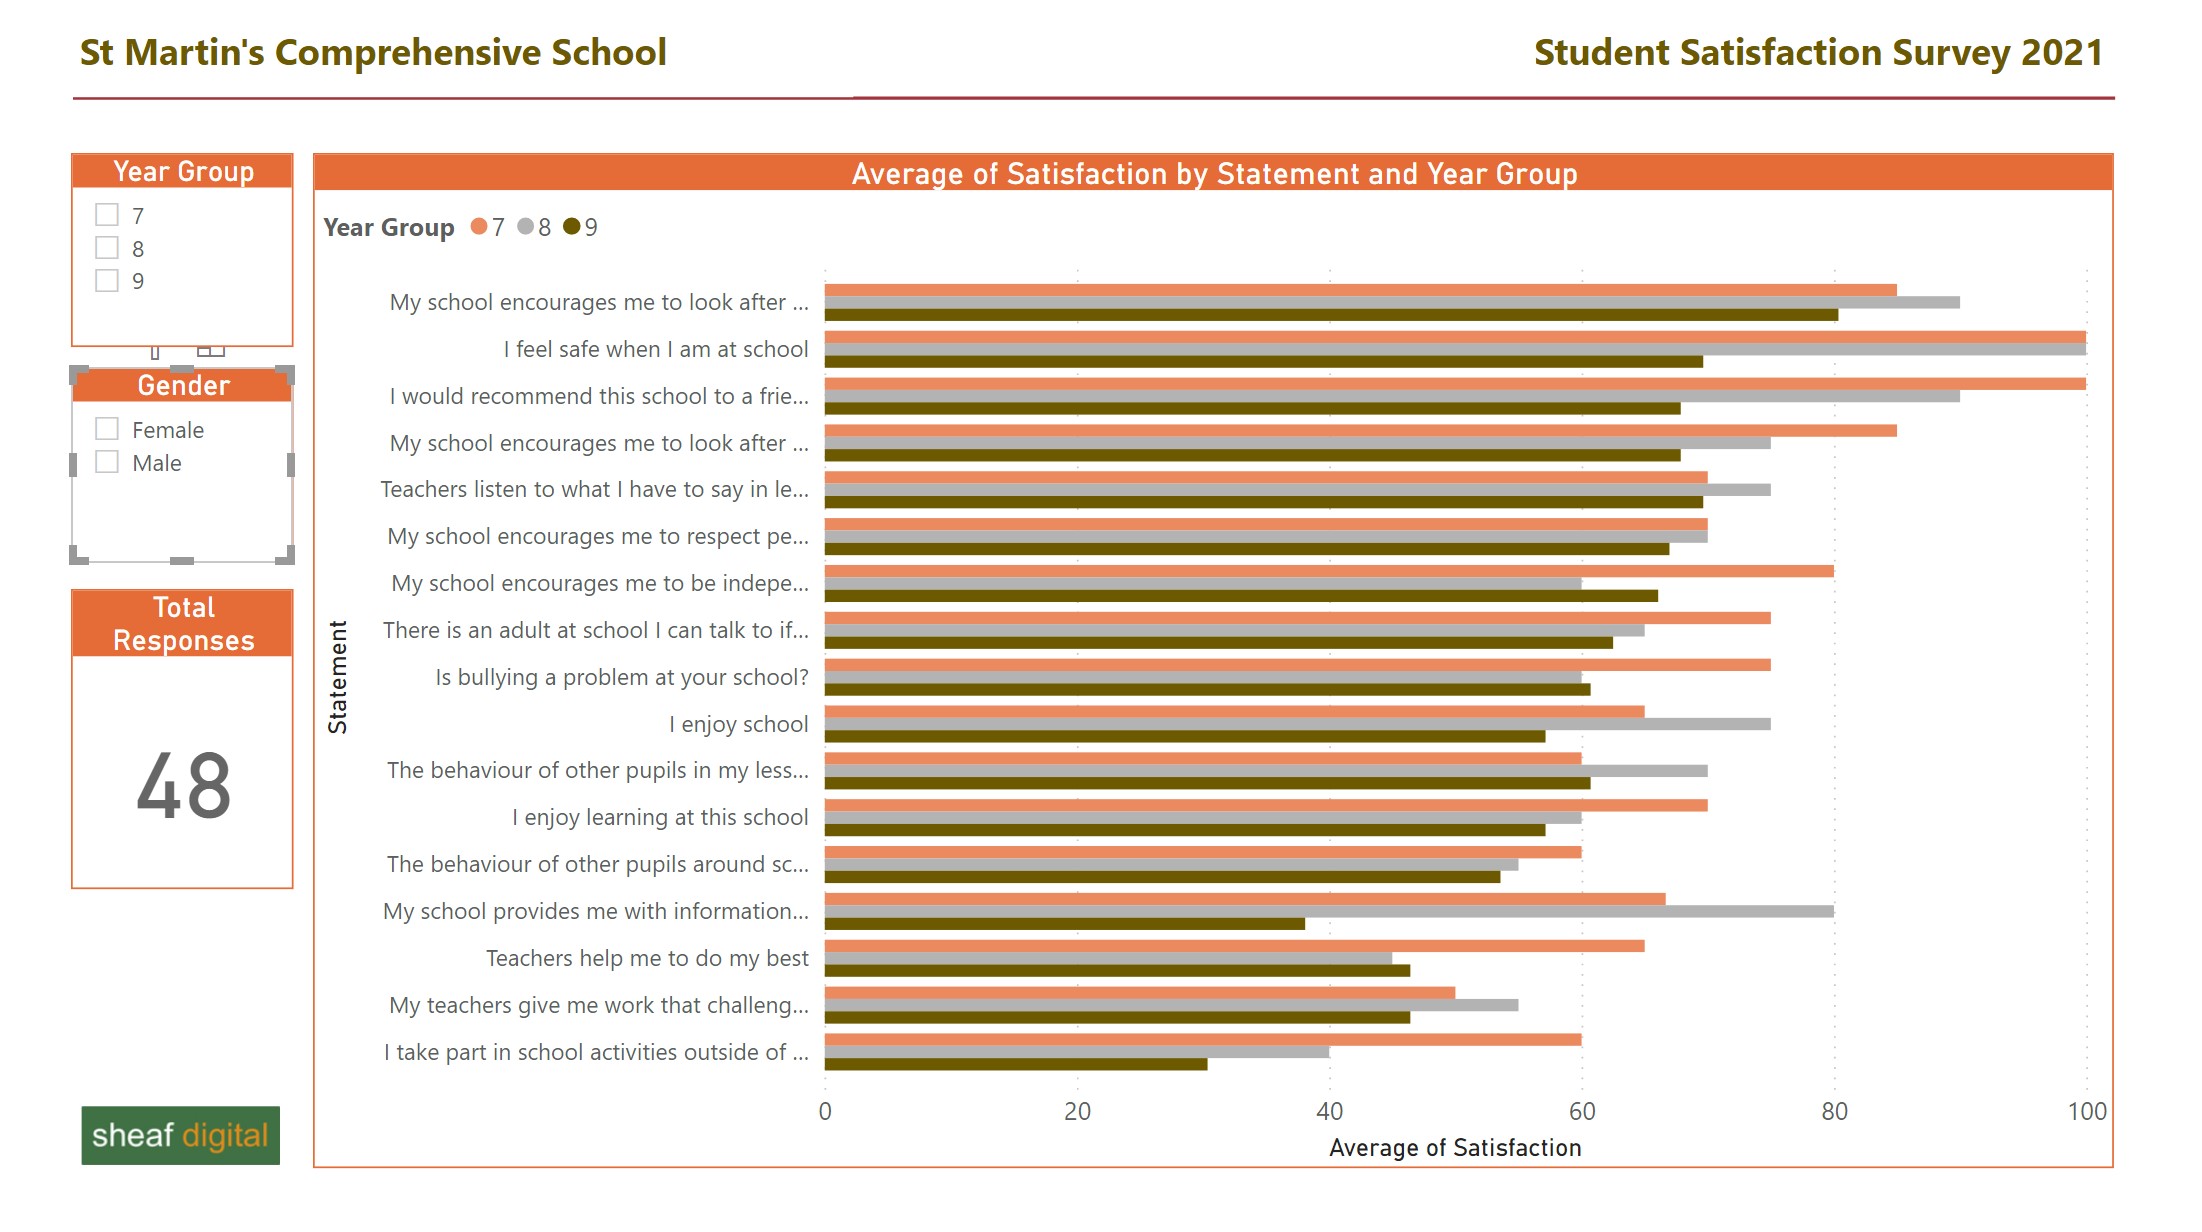
- Complete beginners can start from scratch and write their own Power BI reports, but you need to start super simple. Import a single table of data from Excel and build a one page report. Something like this student satisfaction survey report is a good starting point.
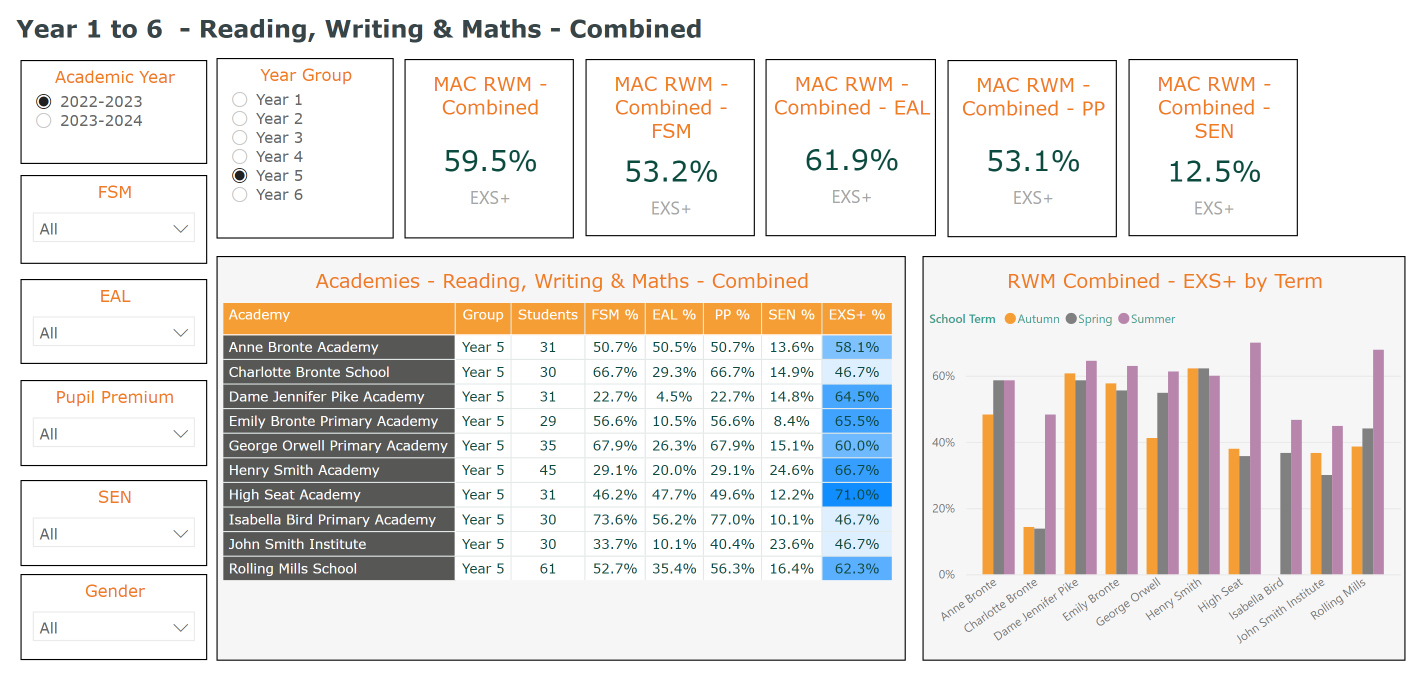
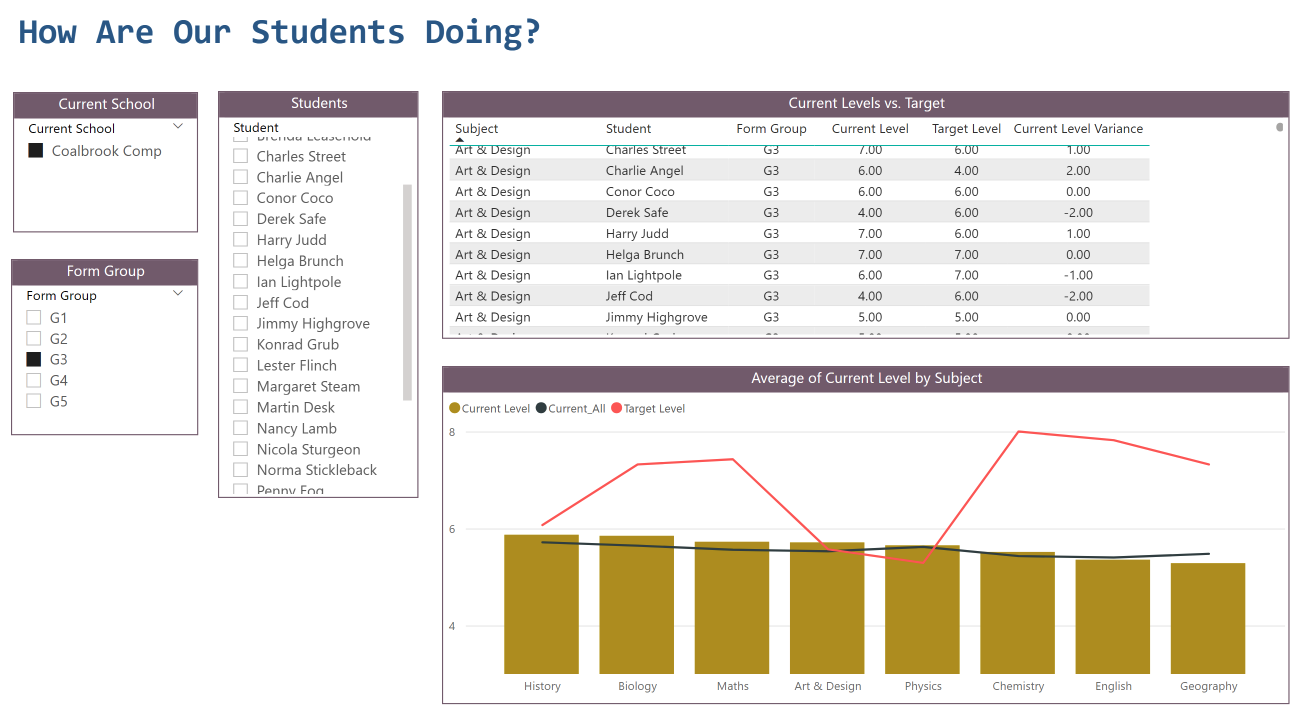
- The next beginners step is a report with two tables - understanding relationships/joins between tables in Power BI underpins everything else. This blog post - Power BI in Schools - a student performance dashboard - uses two tables.
-
Perhaps the next step for a total beginner is to add in a date/calendar table. Pretty much every report involves looking at time based data and a date or calendar table is essential. It’s easy to google Power BI date/calendar table examples. You add the table into your report and join the data column (one-many) to any tables that you want to filter by date, term or academic year.
-
DAX - the language used for writing measures - can be tricky at first, particularly for people who have only previously worked with Excel formulas. It’s important to start writing simple measures early because you can’t avoid measures when you start building Power BI reports with data imported from your MIS data warehouse.
-
The data you import into Power BI - usually multiple tables - is your Power BI ‘model’. It is very easy to end up with a model that is an over complicated collection of tables and joins that becomes confusing and increasingly difficult to work with. There are two ways you can keep things simple.
First, read and understand the Microsoft article about Power BI and star schemas. As mentioned in #2 above, the design of the model is the foundation of the report and it is important to understand why the star schema is so important.
Second, remember that several smaller reports are better than one big report - and remove any tables from your model that you don’t need. I think it is important to understand star schemas, relationships between tables and how the direction of joins controls filtering before you go onto the next step and start importing data from your MIS data warehouse. I’ve seen quite a few Power BI reports that are built on models that are too complicated - they become difficult to maintain and it is hard to track down errors.
-
MIS vendors like Arbor give trusts access via a Power BI connector to a data warehouse. Don’t underestimate the amount of work required to build multi-page assessment reports with data that comes from a data warehouse.
-
It’s also easy to underestimate the amount of time required to test reports - errors in large amounts of data can be hard to spot.
One thing I try to do when I write Power BI reports for school, college or MAT is pass on knowledge - the goal is to get at least one person in the organisation to the point where they can extend a report, or at least understand enough to debug possible problems with data that has been entered into the MIS. Sheaf Digital’s Power BI in Schools service is a practical combination of consultancy advice, report writing and training.
Related Posts
What's the difference between measures and calculated columns in Microsoft Power BI?
Visualising school performance in Microsoft Power BI
Looking for insights - Pearson Correlation and measures in Microsoft Power BI
Scatter Plots, School Performance and Microsoft Power BI
Power BI Cumulative Totals and Measures - Course Sales Pipeline
Slicer visualization in Power BI - filtering by date with help from a simple measure